Data Model
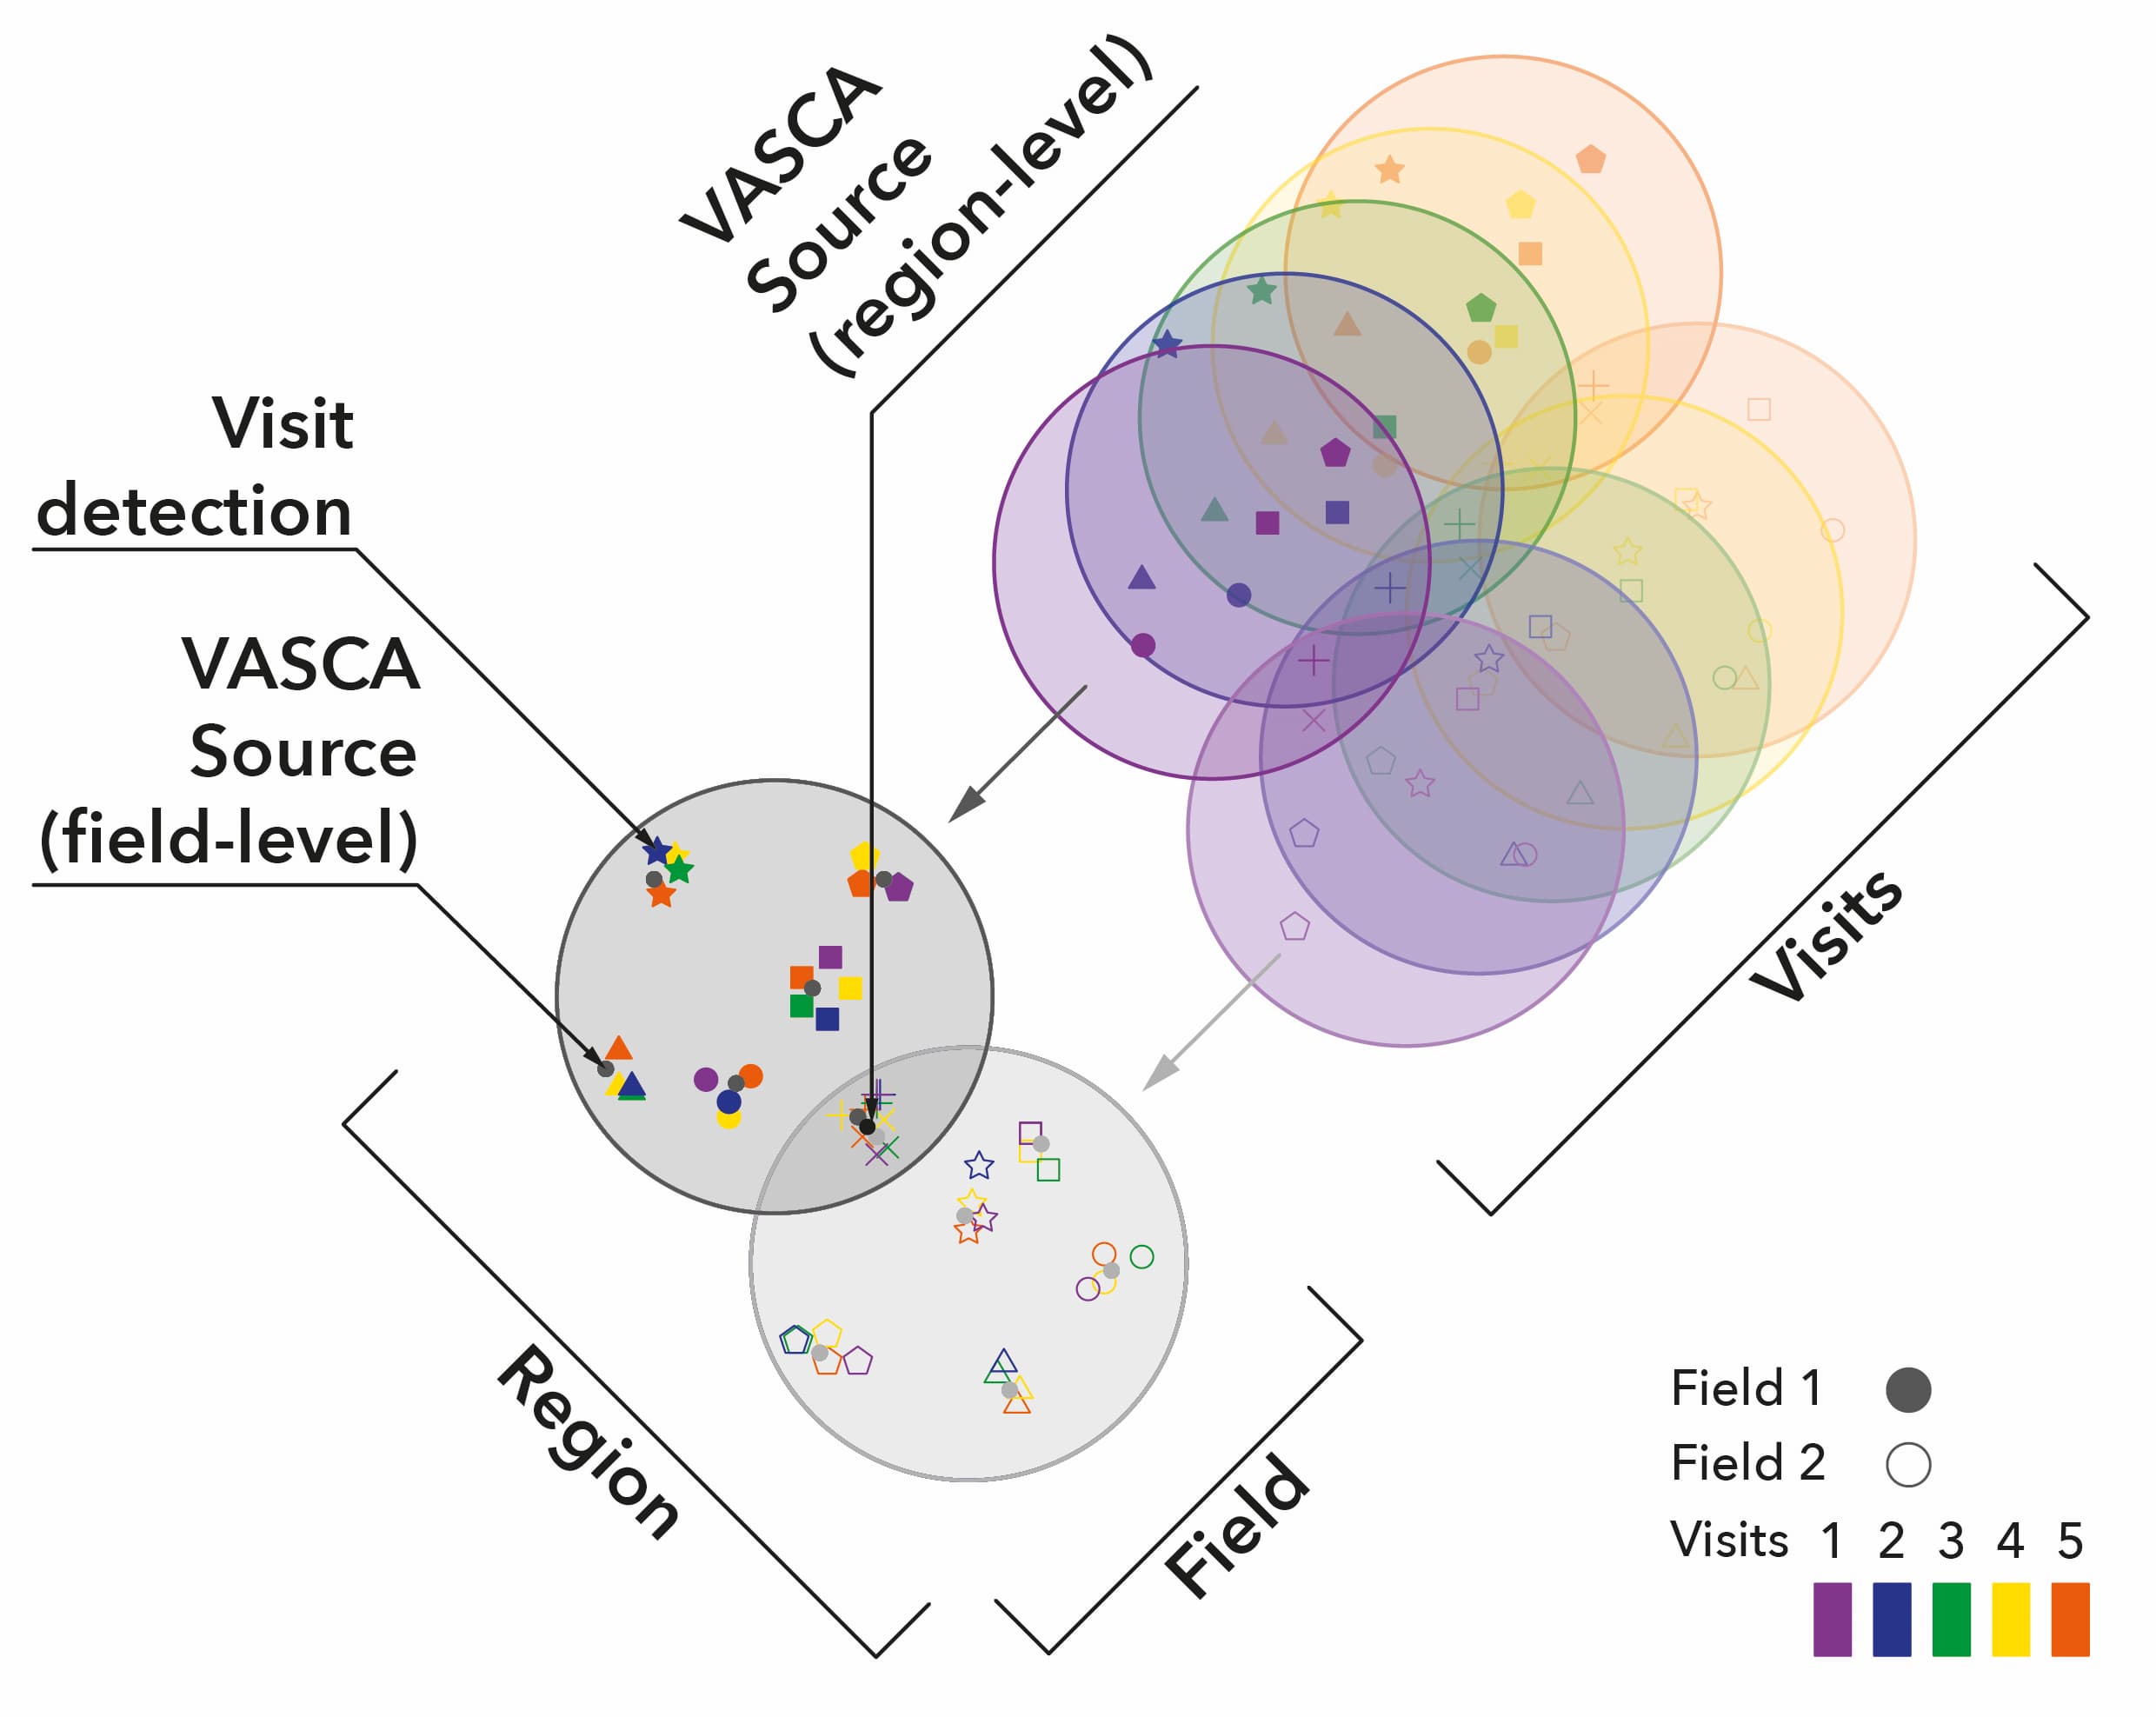
VASCA uses a hierarchical data model which wich defines cosmic sources, individual fields and whole regions in the celestial sky.

The VASCA data model.
This model aims to abstract the input data, astronomical photometric detection lists, in in the most general way possible in order to allow integration of data from multiple instruments and parallel processing of the data.
Input Data
Typically, astronomical photometric surveys observe the sky by segmenting it into fields which correspond to the field of view as defined by the instrument’s telescope optics. A field is then defined by a central coordinate and the diameter of the field of view.
VASCA relies as its input on the science data products that missions/organizations create
from their observational raw data. Specifically this means VASCA takes tables of
photometric detections that have a field and visit ID. A reference of the full list
of required columns can be found below VASCA Columns or in the API reference:
BaseField, Region.
In the case of GALEX, the detection lists created by the mission pipeline (“mcat” files)
have a large number of different observables and parameters (columns) per detection (see
GALEX docs here).
A subset is used by VASCA, where GALEX specific parameters are added to the ones used by
BaseField. This is implemented in the instrument specific TableCollection
object GALEXField and its corresponding column definitions.
Data Structures
All data structures in VASCA are based on TableCollection. As the name suggests
these objects describe a collection of astropy (inv:astropy:std:doc#*.Table) objects. A
general API is provided to add and remove tables to and
from these objects. This is used when, for instance, an individual VASCA Source is
extracted out of a Region.
VASCA Columns
See the full list of data columns defined by VASCA below:
| name | dtype | unit | default | description | |
|---|---|---|---|---|---|
|
Loading ITables v2.2.3 from the init_notebook_mode cell...
(need help?) |
VASCA Tables
Below is a short description of the most important tables that are used in VASCA:
tt_visitsTable that stores metadata about observational visits such as the visit ID (
vis_id), the associated field ID (field_id) and observation start time (time_bin_start) as well as exposure time (time_bin_size).
Note
All parameters related to obersvational timing follow the naming scheme to be compatible with astropy BinnedTimeSeries. This ist then utilized when creating and analyzing light curves for specific sources.
tt_fieldsTable storing metadata about all fields such as the field ID (
field_id), the center coordinates (ra,dec), total exposure time (time_bin_size_sum) and the size of the field of view (r_fov).
tt_detectionsVisit-level detections table. All detections are listed that pass the quality cuts on signal-to-noise (
s2n), artifacts (artifacts) and more. BothRegionandBaseFieldhold this table. So all VASCA-generated ID parameters are limited to the respective scope. Especially this also stores the region/field-level cluster ID for all detections, i.e., the ID that associates all detections belonging to one cosmic source (rg_src_id,fd_src_id).
tt_sourcesSource information table where all cosmic sources are listed that pass the cuts applied used for variability detection. Important variability parameters (
flux_cpval,flux_nxv) and cross-matching results (gaiadr3_match_id,ogrp) are given for each source.
Tip
VASCA supports field-level reference data that might be provided by the
instrument’s mission pipelines. This includes field-averaged (co-added) intensity sky
maps (load_sky_map) and detection lists. This data is stored in
tt_coadd_detections based on which tt_coadd_sources is created during the
region-level clustering stage. This information is useful when visualizing pipeline
results and for consistency checks on the source clustering.
tt_coadd_detectionsReference detections table. This data is provided at the input stage of the pipeline and contains no visit-to-visit information.
tt_coadd_sourcesReference source information table. This table is created in the region-level clustering stage where spatially overlapping detections in
tt_coadd_sourcesare merged.tt_src_id_mapMap between region and field source IDs (
rg_src_id,fd_src_id).tt_filtersInstrument filters, their IDs and index.
tt_coverage_hpRegion observations properties in healpix binning. RING ordering and equatorial coordinates
Tip
Additional tables are created during catalog cross-matching
(tt_simbad or tt_gaiadr3) and post-processing stages
(tt_lombscargle, tt_sed).
VASCA, by design, handles visit-to-visit variability. In post-processing, users can
investigate
inter-visit variability with the help of gPhoton
tt_sedSpectral Energy Distribution from VizieR database.
tt_gphoton_lcLight curve from
gPhoton.gAperturett_spectrumSpectrum table
tt_lombscargleLombScargle results information