GALEX Visits
In this tutorial we are going to inspect the GALEX visits table. This is the full
list of observations by GALEX available on MAST. During initialization of a GALEXField
with given field ID this list is searched for all visits belonging to this field.
import numpy as np
import matplotlib.pyplot as plt
from matplotlib.offsetbox import AnchoredText
import pandas as pd
from astropy.table import Table

from vasca.resource_manager import ResourceManager
import vasca.utils as vutils
# Initialize ResourceManager
rm = ResourceManager()
gal_visits = rm.get_path("gal_visits_list", "vasca")
# tt_gal_visits is a table containing info about all GALEX visits
tt_gal_visits = Table.read(gal_visits)
tt_gal_visits.info()
<Table length=100865>
      name        dtype
---------------- -------
    RATileCenter float64
   DECTileCenter float64
          survey  bytes3
        nexptime float64
        fexptime float64
        imgRunID   int64
  ParentImgRunID   int64
          joinID   int64
         tileNum   int64
     specTileNum   int64
          source  bytes6
   nPhotoObjects   int64
    nPhotoVisits   int64
    PhotoObsDate bytes22
         spectra  bytes5
        nSpectra  bytes4
  nSpectraVisits  bytes4
     SpecObsDate  bytes4
        visitNum   int64
          subvis   int64
 minPhotoObsDate bytes22
 maxPhotoObsDate bytes22
  minSpecObsDate  bytes4
  maxSpecObsDate  bytes4
PhotoObsDate_MJD float64
# Convert astropy Table to pandas DataFrame for better query/aggregation methods
# String columns are bytes in the Table representation and need to decoded in the DataFrame
df_gal_visits = tt_gal_visits.to_pandas().apply(
    lambda x: x.str.decode("utf-8") if x.dtype == "O" else x
)
| RATileCenter | DECTileCenter | nexptime | fexptime | imgRunID | ParentImgRunID | joinID | tileNum | specTileNum | nPhotoObjects | nPhotoVisits | visitNum | subvis | PhotoObsDate_MJD | |
|---|---|---|---|---|---|---|---|---|---|---|---|---|---|---|
|
Loading ITables v2.2.3 from the init_notebook_mode cell...
(need help?) |
Surveys
Find more about GALEX surveys on the documentation page AIS : All-Sky Imaging Survey. Exposure time of 100s over 26,000 square degrees of sky reaching a depth of mAB = 20-2 in both bands.
- MIS
Medium Sky Imaging Survey. Single orbit exposures (1,500s) of 1000 square degrees in positions that match the Sloan Digital Sky Survey (SDSS) spectroscopic footprint.
- DIS
Deep Sky Imaging Survey. Exposure goal of 30,000s over 80 square degrees of sky.
- NGS
Nearby Galaxy Survey. Nearby galaxies with a nominal exposure time of 1000s to 1500s.
- GII
Guest Investigator Imaging. 33% of observing time per year to peer reviewed proposals from the community.
- CAI
Calibration Imaging. White dwarf standards for the purposes of calibration.
Survey Stats
Below are several statistics on the GALEX data set.
Tip
One of the many useful utility functions for visualization is color_palette.
It returns a list of colors for given color map
and specified number of elements
survey_names = ["AIS", "MIS", "DIS", "NGS", "GII", "CAI"]
n_surveys = len(survey_names)
survey_colors = vutils.color_palette("bright", n_surveys, show_in_notebook=True)

# Aggregate
df_survey_grpd = df_gal_visits.groupby("survey")
survey_stats = {}
for survey in survey_names:
    df_survey_visits = df_survey_grpd.get_group(survey)
    stats = {}
    stats["n_vis"] = len(df_survey_visits)
    stats["n_fd"] = len(df_survey_visits.ParentImgRunID.unique())
    stats["texp"] = df_survey_visits.nexptime.sum()
    survey_stats[survey] = stats

df_survey_stats = pd.DataFrame().from_dict(survey_stats).T
# df_survey_stats
| n_vis | n_fd | texp | |
|---|---|---|---|
|
Loading ITables v2.2.3 from the init_notebook_mode cell...
(need help?) |
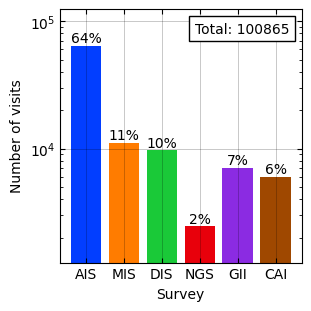
Number of visits
Show code cell source
plot_name = "n_vis"
fig, ax = plt.subplots(num=plot_name, figsize=(3, 3), layout="constrained")

total = df_survey_stats.n_vis.sum()
text = AnchoredText(f"Total: {total:1.0f}", loc="upper right")
ax.add_artist(text)

bars = ax.bar(
    survey_names,
    df_survey_stats.n_vis,
    color=survey_colors,
)
ax.bar_label(bars, labels=[f"{x:1.0%}" for x in df_survey_stats.n_vis / total])
ax.margins(y=0.2)

ax.set_ylabel("Number of visits")
ax.set_xlabel("Survey")
ax.set_yscale("log")
ax.grid(visible=True, linewidth=0.5, color="k", alpha=0.3, zorder=0)
ax.tick_params(axis="y", direction="in", left=True, right=True, which="both")
ax.tick_params(axis="x", direction="in", top=True, bottom=True, which="both")
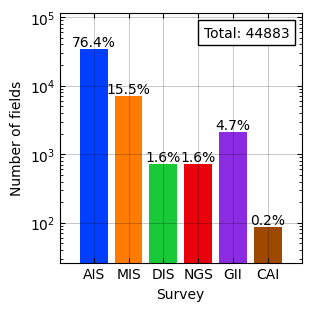
Number of fields
Show code cell source
plot_name = "n_fields"
fig, ax = plt.subplots(num=plot_name, figsize=(3, 3), layout="constrained")

total = df_survey_stats.n_fd.sum()
text = AnchoredText(f"Total: {total:1.0f}", loc="upper right")
ax.add_artist(text)

bars = ax.bar(
    survey_names,
    df_survey_stats.n_fd,
    color=survey_colors,
)
ax.bar_label(bars, labels=[f"{x:1.1%}" for x in df_survey_stats.n_fd / total])
ax.margins(y=0.2)
ax.margins(x=0.1)

ax.set_ylabel("Number of fields")
ax.set_xlabel("Survey")
ax.set_yscale("log")
ax.grid(visible=True, linewidth=0.5, color="k", alpha=0.3, zorder=0)
ax.tick_params(axis="y", direction="in", left=True, right=True, which="both")
ax.tick_params(axis="x", direction="in", top=True, bottom=True, which="both")
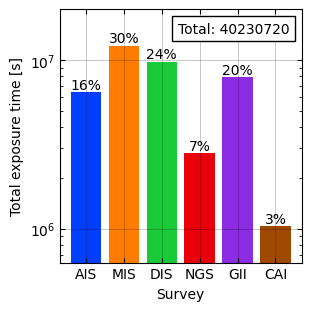
Total exposure time
Show code cell source
plot_name = "texp"
fig, ax = plt.subplots(num=plot_name, figsize=(3, 3), layout="constrained")

total = df_survey_stats.texp.sum()
text = AnchoredText(f"Total: {total:1.0f}", loc="upper right")
ax.add_artist(text)

bars = ax.bar(
    survey_names,
    df_survey_stats.texp,
    color=survey_colors,
)
ax.bar_label(bars, labels=[f"{x:1.0%}" for x in df_survey_stats.texp / total])
ax.margins(y=0.2)

ax.set_ylabel("Total exposure time [s]")
ax.set_xlabel("Survey")
ax.set_yscale("log")
ax.grid(visible=True, linewidth=0.5, color="k", alpha=0.3, zorder=0)
ax.tick_params(axis="y", direction="in", left=True, right=True, which="both")
ax.tick_params(axis="x", direction="in", top=True, bottom=True, which="both")
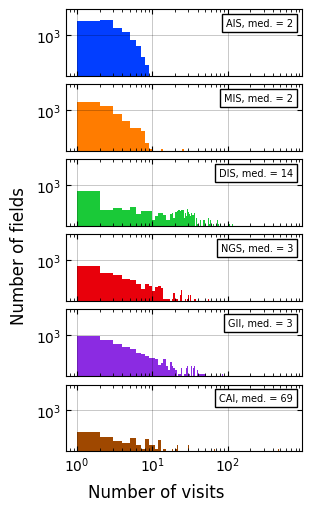
Number of visits per field distribution
Tip
Another useful utility for visualization is the get_hist_bins function which
returns the bin edges for given bin size and a list of non-uniform 1-D data sets.
Show code cell source
survey_nvis = {}
for survey in survey_names:
    df_survey_visits = df_gal_visits.query("survey==@survey")
    df_fd_grpd = df_survey_visits.groupby("ParentImgRunID")
    survey_nvis[survey] = [len(df_grp) for _, df_grp in df_fd_grpd]
bins = vutils.get_hist_bins(list(survey_nvis.values()), bin_size=1)

plot_name = "nvis_dist"
fig, axs = plt.subplot_mosaic(
    [[x] for x in survey_names],
    num=plot_name,
    figsize=(3, 5),
    layout="constrained",
    sharey=False,
    sharex=True,
)

for i, survey in enumerate(survey_names):
    ax = axs[survey]

    ax.hist(survey_nvis[survey], bins=bins, color=survey_colors[i])

    text = AnchoredText(
        f"{survey}, med. = {np.asarray(survey_nvis[survey]).mean():1.0f}",
        loc="upper right",
        prop={"fontsize": 7},
    )
    ax.add_artist(text)

    ax.set_ylim((0.7, 1e5))
    ax.set_xscale("log")
    ax.set_yscale("log")

    ax.grid(visible=True, linewidth=0.5, color="k", alpha=0.3, zorder=0)
    ax.tick_params(axis="y", direction="in", left=True, right=True, which="both")
    ax.tick_params(axis="x", direction="in", top=True, bottom=True, which="both")

fig.supylabel("Number of fields")
_ = fig.supxlabel("Number of visits")
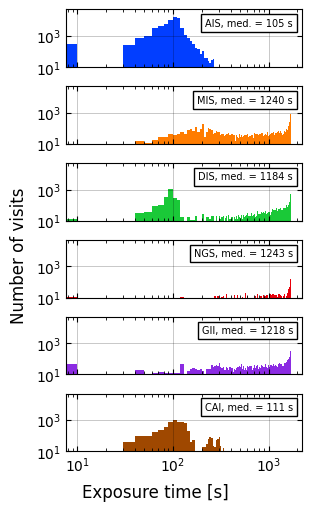
Exposure time distribution
Show code cell source
bins = vutils.get_hist_bins(
    [df_gal_visits.query("survey==@x").nexptime.tolist() for x in survey_names],
    bin_size=10,  # Seconds
)

plot_name = "texp_dist"
fig, axs = plt.subplot_mosaic(
    [[x] for x in survey_names],
    num=plot_name,
    figsize=(3, 5),
    layout="constrained",
    sharey=True,
    sharex=True,
)

for i, survey in enumerate(survey_names):
    ax = axs[survey]
    data = df_gal_visits.query("survey==@survey").nexptime
    ax.hist(data, color=survey_colors[i], bins=bins, label=survey)

    text = AnchoredText(
        f"{survey}, med. = {np.median(data):1.0f} s",
        loc="upper right",
        prop={"fontsize": 7},
    )
    ax.add_artist(text)

    ax.set_ylim((10, 5e4))
    ax.set_xscale("log")
    ax.set_yscale("log")

    ax.grid(visible=True, linewidth=0.5, color="k", alpha=0.3, zorder=0)
    ax.tick_params(axis="y", direction="in", left=True, right=True, which="both")
    ax.tick_params(axis="x", direction="in", top=True, bottom=True, which="both")

fig.supylabel("Number of visits")
_ = fig.supxlabel("Exposure time [s]")